Nondetections-Censored and Truncated Data
In the real world, data collection is often incomplete or constrained by various factors. To fully utilize available data, it is sometimes necessary to handle ‘censored’ and ’truncated’ data, particularly in fields such as medical studies, reliability engineering, and astronomy.
Censored Data
Censored data occurs when the value of a measurement exists, but we only know that it falls above or below certain limits:
- Left-Censored Data (Upper Limit): The actual data point is less than a certain value, but the exact value is unknown. This is common in astronomy; for example, a star’s luminosity might be below the detection limit of a telescope. We know only the upper limit of the star’s luminosity.
- Right-Censored Data (Lower Limit): The actual data point is greater than a certain value, but the exact value is unknown.
Truncated Data
Truncated data occurs when data points below or above a certain threshold are not just unknown but completely absent from the dataset. Unlike censoring, with truncation, we do not have any information that data points exist outside of the observed range.
These characteristics have implications for statistical analysis, including distribution function estimation, correlation analysis, regression modeling, and hypothesis testing.
Survival and Hazard Functions in Censoring
Censoring techniques often use concepts from survival analysis:
- Survival Function ($S(x)$): Represents the probability that a variable $X$ exceeds a certain value $x$. $$ S(x) = P(X > x) = 1 - F(x) $$
- Hazard Rate ($h(x)$): Represents the conditional failure rate at a certain value. $$ h(x) = \frac{f(x)}{S(x)} $$ Here, $f(x)$ is the PDF at $x$, and the hazard rate can be interpreted as the likelihood of an event occurring at $x$ given that it has not occurred before $x$.
Clarifying the Example on Hazard Rate
Consider an example where:
- $f(95) = 1\%$: The probability of dying at the age of 95 is 1%.
- $S(95) = 2\%$: The probability of surviving past the age of 95 is 2%.
To find the hazard rate $h(x)$ at age 95: $$ h(95) = \frac{0.01}{0.02} = 0.5 \text{ or } 50\% $$ This indicates that, given reaching age 95, there is a 50% chance of dying at that age.
Advanced Estimators for Censored and Truncated Data
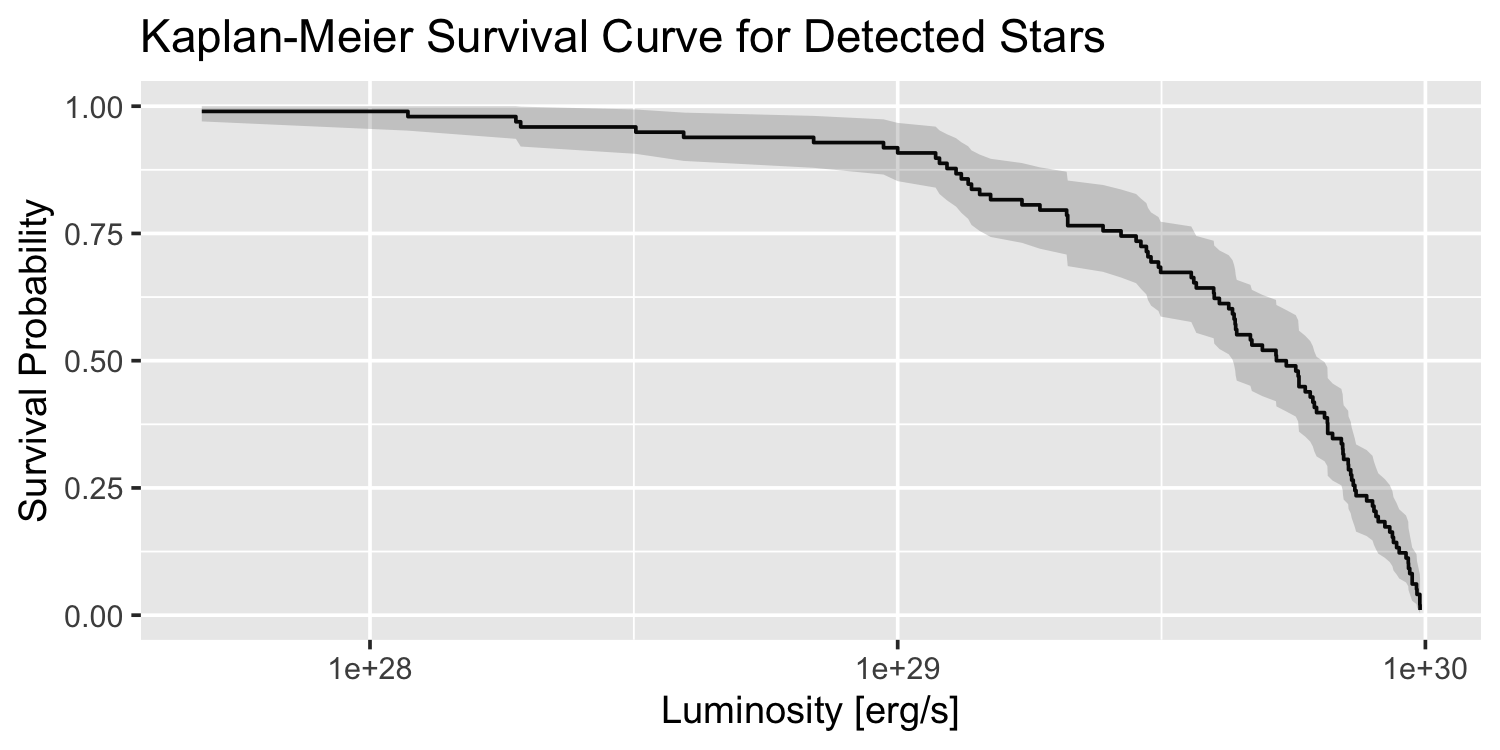
- Kaplan-Meier Nonparametric Estimator (Censored): The Kaplan-Meier estimator is crucial for analyzing survival data, particularly in medical research. It measures the fraction of subjects living for a certain amount of time after treatment. This estimator is particularly effective in handling right-censored data, where the survival time is only known to exceed a certain duration but the exact time of event (e.g., death, failure) is unknown. The Kaplan-Meier estimator uses the available data to estimate the survival function, $S(t)$, which provides insights into the likelihood of survival beyond observed time points.
Below is an example plot of the KM estimated survival curve of synthetic data on stellar luminosity data.
 Figure data credit: Sanya Arora
- Lynden-Bell–Woodroofe Estimator (Truncated): Commonly utilized in astronomical studies, the Lynden-Bell–Woodroofe estimator addresses issues with truncated samples, where observations below or above certain thresholds are missing entirely from the dataset. This estimator operates under the assumption that all observations derive from the same underlying distribution. It uses the observed distribution of the available data to estimate the distribution functions of the truncated segments, facilitating a more comprehensive understanding of the overall data distribution.
Both estimators are tailored to specific types of incomplete data: Kaplan-Meier for censored data, where some information about the survival time is available, and Lynden-Bell–Woodroofe for truncated data, where parts of the data are completely missing. Understanding their applications and differences is essential for accurately analyzing datasets characterized by incomplete observations.