Variogram
Introduction to Variograms
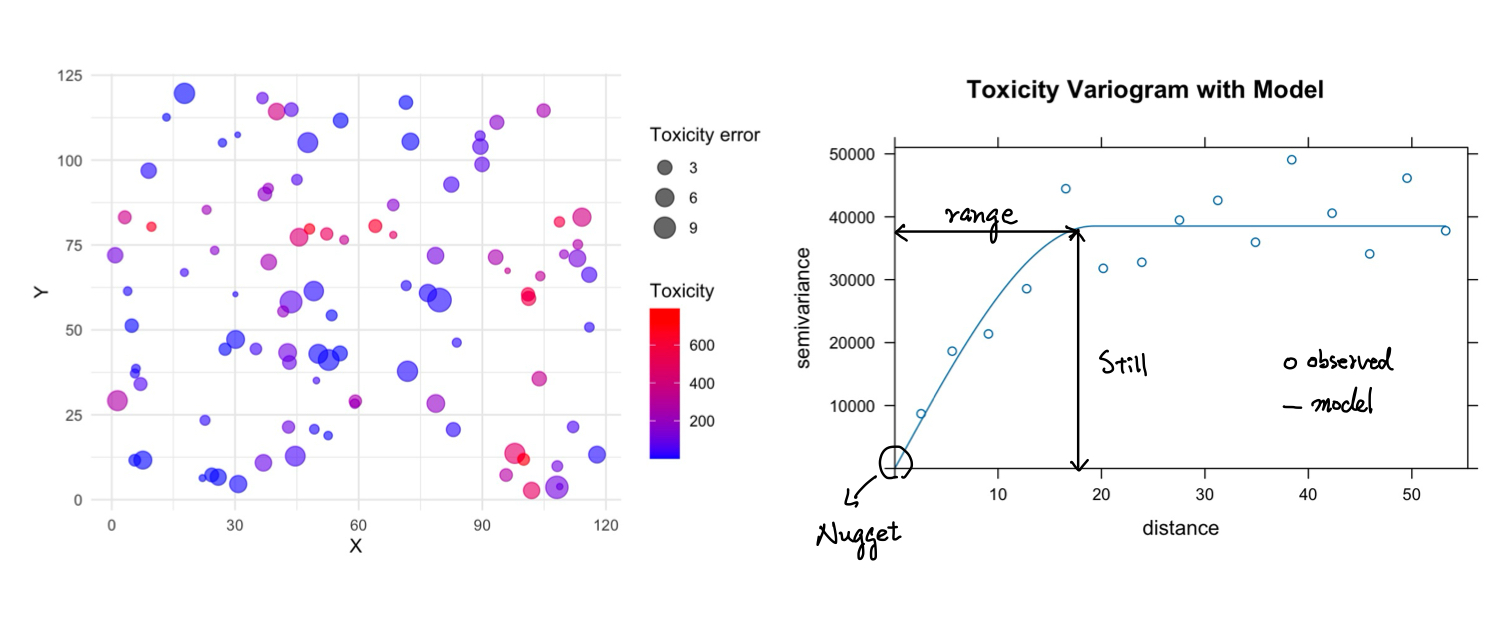
A variogram is a fundamental tool in spatial statistics used to describe the spatial dependence and variability of data. It quantifies how data values at different locations relate to one another over space, essentially measuring the degree of spatial correlation. The variogram has lek features of: “nugget,” “sill,” and “range.”
- Nugget: Represents the variation at small distances attributable to measurement errors or spatial microscale variation not resolved by the sampling.
- Sill: The plateau reached by the variogram, beyond which the increments in distance do not significantly increase the variance. It represents the level of total variance within the dataset.
- Range: The distance at which the variogram reaches the sill, beyond which locations are no longer correlated.
Example of Spatial Data and Variogram
Plots below show an example of spatial data (left) and its associated variogram (right). The plot on the left shows synthetic data in spatial X-Y coordinates color-coded by the level of toxicity measured at that location. The size of the circle is associated with the measurement error, which is not used here. The variogram on the right shows how the semi-variance between points increases with distance. It features a “nugget” effect at the origin, indicating measurement noise or microscale variability. The curve approaches a “sill,” beyond which the variance stabilizes, suggesting that points beyond this “range” do not influence each other. This range is critical for understanding the spatial continuity and predicting values at unsampled locations.
 Figure data credit: Charles M Pacheco
Example R Code for the Variogram
library(gstat)
library(sp)

# Defining spatial coordinates
# df_2 is a dataframe with colums x and y
coordinates(df_2) <- ~x+y

# Creating Variograms
variogram_tox <- variogram(toxicity ~ 1, df_2)

# Fit the variogram and plot it out.
# gamma: the semi-variance
# vgm: "variogram model,"
model_tox <- fit.variogram(
  variogram_tox, model = vgm(psill = max(variogram_tox$gamma),
  model = "Sph",
  range = 30))

# Plot the empirical variogram and the fitted model
plot(variogram_tox, model = model_tox,
  main = "Toxicity Variogram with Model")